
Mines Game With 3 vs 5 Mines: Why the First Tile Risk Changes
Compare 3 vs 5 mines on a 25-tile Mines board. Understand safe-tile probability, how risk changes after each reveal, cumulative survival chances and the difference between odds and payout multipliers.
In this article
- What Is the Jai Club Mines Game?
- Understanding a 25-Tile Mines Board
- First Tile Probability With Three Mines
- First Tile Probability With Five Mines
- Does the Tile's Position Change the Probability?
- Why the Second Tile Has Different Odds
- Conditional Probability vs Cumulative Probability
- Three Consecutive Safe Tiles
- What Happens After Five Safe Reveals?
- Why Mines Probabilities Change After Every Reveal
- Understanding the Combinations Formula
- Why More Mines Can Mean Larger Multipliers
- Fair Multiplier vs Actual Multiplier
- Can Choosing a Different Tile Improve the Odds?
- Does a Previous Mine Reveal Affect the Next Round?
- Mines vs Crash Games
- Frequently Asked Questions
- What is the probability of a safe first tile with three mines?
- What is the first-tile probability with five mines?
- Is a corner tile safer than the middle?
- Why does the next-tile probability decrease?
- What is the probability of five safe reveals with three mines?
- What is the probability of five safe reveals with five mines?
- Do more mines guarantee a higher financial return?
- Can old Mines screenshots reveal future safe tiles?
- Conclusion
A Mines game displays a board of covered tiles. Some tiles are safe, while others conceal mines. The interface may allow the number of mines to be selected before a round begins.
At first glance, changing the mine count from three to five may seem like a small adjustment. The board still looks the same, and the player still needs to reveal safe tiles.
However, the mathematical risk changes immediately.
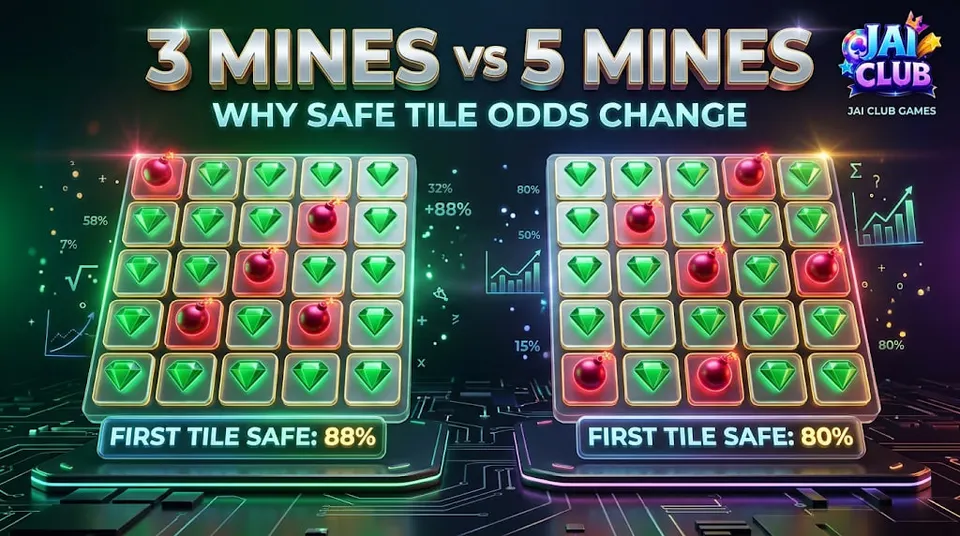
On a hypothetical 25-tile board, the probability of revealing a safe first tile is 88% with three mines but only 80% with five mines.
The difference becomes more noticeable when several safe tiles must be revealed consecutively.
For readers researching the Jai Club Mines game, understanding this probability structure is more useful than assuming that a particular corner, colour or sequence of clicks has a hidden advantage.
This article compares three-mine and five-mine settings, explains how probabilities change during a round and shows why higher payout multipliers do not automatically mean better expected returns.
The calculations assume a 5×5 board with mines placed uniformly at random. They are mathematical examples rather than independently verified odds or multipliers for every Mines implementation.
What Is the Jai Club Mines Game?
Mines is a grid-based game format commonly discussed in Jai Club-related gaming searches.
A typical version uses covered tiles, with some containing hidden mines and the others representing safe positions.
The outcome depends on whether the selected tile contains a mine.
In many versions, the round may continue after a safe reveal, while selecting a mine ends the round unsuccessfully.
However, the exact interface, available settings and settlement conditions vary between implementations.
The name Mines does not guarantee that every game uses an identical board size or payout table.
For the calculations in this article, the board contains 25 tiles arranged in five rows and five columns.
This provides a clear mathematical model for comparing different mine counts.
Understanding a 25-Tile Mines Board
A 5×5 grid contains 25 covered positions.
If three positions contain mines, the remaining 22 positions are safe.
If five positions contain mines, the remaining 20 positions are safe.
The board dimensions remain identical in both situations.
What changes is the proportion of safe positions.
With three mines, 22 out of 25 positions are safe.
With five mines, only 20 out of 25 are safe.
This distinction explains why adding two mines changes the probability of a successful first reveal.
The position selected is not inherently special under the uniform random placement model.
The relevant information is the number of mines and the number of unrevealed positions.
First Tile Probability With Three Mines
Suppose the board contains three mines and 22 safe tiles.
Every tile is equally likely to contain a mine under the assumed model.
Therefore, the probability of selecting a safe tile on the first reveal is:
22 ÷ 25 = 0.88.
Expressed as a percentage, that is 88%.
The probability of selecting a mine is the remaining 12%.
These are complementary outcomes because a tile must be either safe or mined within the model.
A first reveal can succeed even though the board contains hidden mines.
However, an 88% survival probability is not a guarantee.
A mine can still be selected on the first attempt.
First Tile Probability With Five Mines
Now increase the number of hidden mines to five.
The board still contains 25 positions, but only 20 are safe.
The probability of revealing a safe tile first becomes:
20 ÷ 25 = 0.80.
That corresponds to 80%.
The probability of immediately selecting a mine becomes 20%.
Compared with the three-mine setting, the first-reveal survival probability has decreased by eight percentage points.
The chance of selecting a mine has increased from 12% to 20%.
This illustrates why a relatively small change in mine count can have a meaningful effect on the first decision.
Does the Tile's Position Change the Probability?
Under uniform random mine placement, no particular covered position has a mathematical advantage before any tile has been revealed.
A corner tile has the same initial probability as a central tile.
The same applies to the positions along the board's edges.
This is because the assumed result mechanism treats every valid mine arrangement as equally likely.
If the board contains three mines, the initial probability that a particular position is safe remains 22 out of 25.
Choosing the same corner in every round does not alter that fraction.
However, this conclusion depends on uniform placement.
A different or non-uniform game mechanism would require separate evidence about its actual probabilities.
Why the Second Tile Has Different Odds
After a safe first reveal, the board has changed.
One safe position is now known and no longer remains among the covered tiles.
With three mines, there are 24 covered positions left, including 21 safe positions and three mines.
The probability that the next selected covered tile is safe is therefore:
21 ÷ 24 = 87.5%.
With five mines, there are 19 safe positions and five mines among the 24 remaining covered tiles.
The next-reveal survival probability becomes:
19 ÷ 24 = approximately 79.17%.
These figures are conditional probabilities.
They assume the first selected tile was safe.
They should not be confused with the probability of surviving two reveals from the beginning of the round.
Conditional Probability vs Cumulative Probability
This distinction is one of the most important parts of Mines mathematics.
Conditional probability asks about the next reveal after a particular sequence has already succeeded.
Cumulative probability asks about successfully completing the entire sequence from the start.
For example, with three mines, the first reveal is safe with probability 88%.
Given that the first reveal was safe, the second is safe with probability 87.5%.
The probability of surviving both reveals is:
0.88 × 0.875 = 0.77.
That is 77%.
With five mines, the first reveal succeeds with probability 80%.
The second succeeds conditionally with probability 19/24.
The probability of surviving both is approximately 63.33%.
This explains why two individually plausible reveals can have a much lower combined survival probability.
Three Consecutive Safe Tiles
Consider revealing three tiles in the same round.
For a board with three mines, the probability is calculated by multiplying the successive safe proportions:
22/25 × 21/24 × 20/23.
The result is approximately 66.96%.
For a board containing five mines, the corresponding calculation is:
20/25 × 19/24 × 18/23.
This gives approximately 49.57%.
The difference is substantial.
On the five-mine board, the probability of successfully completing the first three reveals is slightly below 50% under the assumed model.
On the three-mine board, it is approximately two-thirds.
The game interface may make both situations look similar because the board dimensions remain unchanged.
The mathematical risk, however, is different.
What Happens After Five Safe Reveals?
The difference becomes even clearer when comparing five consecutive safe selections.
With three mines, the probability of surviving five reveals is approximately 49.57%.
With five mines, the probability is approximately 29.18%.
These values are calculated from the number of ways to select safe positions without encountering a mine.
The five-mine configuration has a lower cumulative survival probability because the board contains fewer safe positions.
It is important not to interpret a 29.18% probability as meaning that a successful sequence can be predicted from previous failures.
The figure describes the theoretical chance of one defined event under the stated assumptions.
It does not reveal the hidden mine positions.
Why Mines Probabilities Change After Every Reveal
A Mines board contains a fixed number of covered positions.
After each safe reveal, one safe position has been removed from the unknown group.
The number of hidden mines remains unchanged until a mine is selected or the round ends, assuming the model does not relocate mines.
Therefore, the proportion of safe positions among the remaining covered tiles decreases after each successful reveal.
This is why later selections become conditionally more difficult.
For example, a three-mine board initially has 22 safe tiles among 25 positions.
After five successful reveals, it has 17 safe positions among 20 covered tiles.
The next-reveal survival probability is then 17/20, or 85%.
This differs from the original 88% first-reveal probability.
Understanding the Combinations Formula
The cumulative survival probability can also be calculated using combinations.
For a board containing 25 tiles and m mines, the number of safe positions is 25 − m.
If k tiles are selected, the chance of all k being safe is:
C(25 − m, k) ÷ C(25, k).
Here, C represents the number of ways to choose a specified number of positions from a larger group.
The numerator counts selections consisting entirely of safe tiles.
The denominator counts all possible selections of the same size.
This formula assumes that mine positions are uniformly distributed and selections do not reveal additional information beyond whether a tile is safe.
It is a mathematical probability model, not a claim about a particular provider's published game algorithm.
Why More Mines Can Mean Larger Multipliers
A game may offer larger payout multipliers for successful outcomes that have lower probabilities.
For example, surviving several reveals on a five-mine board is generally less likely than surviving the same number on a three-mine board.
A larger potential multiplier may reflect that additional difficulty.
However, multiplier size alone does not establish a favourable expected return.
To evaluate a payout mathematically, both the probability of achieving the relevant result and the actual multiplier must be considered.
A provider may also include a margin or house edge in its payout calculations.
The exact figures cannot be assumed from the mine count alone.
Fair Multiplier vs Actual Multiplier
A theoretical fair total-return multiplier is the reciprocal of an event's probability when a successful outcome pays that multiplier and an unsuccessful outcome pays nothing.
For example, the first safe reveal with three mines has probability 0.88.
The theoretical break-even multiplier is approximately 1.1364×.
With five mines, the first-reveal survival probability is 0.80.
The corresponding break-even multiplier is 1.25×.
These are mathematical break-even figures.
A real game may display lower values after accounting for its own payout structure and margin.
The figures should not be presented as verified Jai Club multipliers.
The difference between theoretical odds and actual payout terms is essential when interpreting any Mines interface.
Can Choosing a Different Tile Improve the Odds?
Under the uniform random model, choosing a different unopened tile does not improve the probability merely because of its location.
A player might prefer corners, diagonal patterns or the same row every time.
However, those patterns do not provide information about where the mines were placed.
A sequence that succeeded in an earlier round does not establish that the same sequence will be safe in a future independently generated round.
This is a common source of misleading Mines prediction claims.
A visually memorable sequence is not necessarily a mathematically advantageous one.
The relevant probability comes from the mine distribution and remaining tiles, not a pattern drawn across the board.
Does a Previous Mine Reveal Affect the Next Round?
A previous round can provide information about that completed board.
It does not automatically reveal anything about a new independently generated board.
For example, suppose a mine appeared in the top-left position during one round.
That does not mean the same position must be safe next time.
Likewise, a safe corner in one round does not establish that it will remain safe in future rounds.
These assumptions would require evidence that the game reuses or links its mine placements across rounds.
Without such evidence, previous screenshots cannot provide a reliable map of future mine locations.
Mines vs Crash Games
Mines and crash games can both display changing multipliers, but their underlying events differ.
A crash game commonly uses a multiplier endpoint that terminates an active round.
Mines uses a set of concealed positions, with the probability of surviving additional selections depending on the remaining safe and mined tiles.
A 2× multiplier in a Mines game therefore should not be assumed to have the same probability as a 2× target in a crash game.
Each game has its own mathematical model.
For a related explanation of crash endpoints, read Can a Crash Game End at 1.00×?.
Frequently Asked Questions
What is the probability of a safe first tile with three mines?
On a uniformly random 25-tile board, 22 positions are safe, giving an 88% probability.
What is the first-tile probability with five mines?
Twenty of the 25 positions are safe, so the probability is 80%.
Is a corner tile safer than the middle?
Not under uniform random mine placement. Every initially covered position has the same probability.
Why does the next-tile probability decrease?
After a safe reveal, fewer safe positions remain covered while the number of hidden mines stays unchanged.
What is the probability of five safe reveals with three mines?
Approximately 49.57% under the stated 25-tile model.
What is the probability of five safe reveals with five mines?
Approximately 29.18% under the same assumptions.
Do more mines guarantee a higher financial return?
No. Higher potential multipliers do not automatically imply better expected returns.
Can old Mines screenshots reveal future safe tiles?
Not when new rounds use independent mine placements.
Conclusion
Comparing three mines with five mines shows why the number of hidden hazards is more important than the board's visual appearance.
On a 25-tile grid, three mines produce an 88% chance of a safe first reveal. Five mines reduce that probability to 80%.
The difference becomes larger across several consecutive selections, because cumulative survival probabilities multiply.
Understanding conditional probability, cumulative probability and theoretical multipliers helps readers interpret the Mines format more accurately.
For a broader introduction to multiplier-based games and other Jai Club gaming categories, visit the Jai Club Games overview.
The mathematics describes the risk of a defined event. It does not provide a method of identifying hidden mines in advance.