
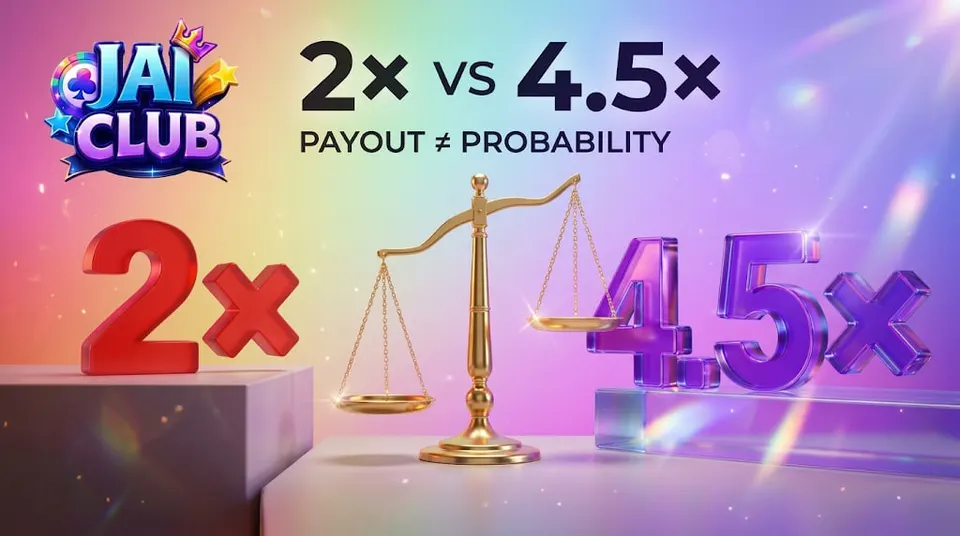
Colour Trading 2× vs 4.5×: Why Bigger Payouts Can Be Misleading
Is a 4.5× colour trading payout really better than 2×? Explore payout multipliers, break-even probabilities, expected returns and why higher rewards do not guarantee better results.
In this article
- Colour Trading 2× vs 4.5×: Why Bigger Payouts Can Be Misleading
- Why Does a 4.5× Payout Look Better Than 2×?
- The Missing Factor: Probability of the Outcome
- Understanding Expected Return in Colour Trading
- 2× vs 4.5×: Complete Example Comparison
- What Is Break-Even Probability?
- Why Break-Even Probability Matters
- Why Violet May Display a Higher Multiplier
- The Special Problem With Partial Payouts
- Total Return vs Net Profit: A Common Multiplier Mistake
- How Does House Edge Relate to the Payout?
- Does a Bigger Multiplier Mean Greater Risk?
- Can Previous Colour Results Change the Payout Probability?
- Why a 90% Return Does Not Mean a 90% Win Rate
- How to Interpret a Colour Trading Payout Table
- Frequently Asked Questions
- Is 4.5× better than 2× in colour trading?
- What does a 2× payout mean?
- What is the break-even probability for 4.5×?
- Why does Violet sometimes have a higher multiplier?
- What is expected return?
- Can a 2× option still have a negative expected return?
- Do repeated Red or Green results change the next payout?
- Does a 4.5× reward mean 4.5 times the profit?
- Conclusion
Colour Trading 2× vs 4.5×: Why Bigger Payouts Can Be Misleading
Imagine two colour trading options on a gaming screen. One displays a 2× multiplier, while the other advertises 4.5×.
At first glance, 4.5× seems more attractive. For the same ₹100 stake, one multiplier suggests a ₹200 return and the other suggests ₹450.
But there is a problem with comparing those two figures directly: a larger payout does not tell you how likely that payout is to occur.
The missing information is probability.
In colour trading, the relationship between the outcome probability, payout multiplier and settlement rules determines the mathematical expected return. A multiplier on its own is not enough to establish whether an option offers a better return.
This article explains the difference using simple calculations, hypothetical examples and the mathematics behind payout structures.
Important: The multipliers in this guide are illustrative examples found in some colour trading formats. They are not a verified current payout table for any particular Jai Club service.
Why Does a 4.5× Payout Look Better Than 2×?
Human attention naturally moves towards the larger number.
When two rewards are presented side by side, a 4.5× multiplier looks more impressive than 2× because the advertised amount is more than twice as large.
Consider an illustrative ₹100 stake.
| Displayed Multiplier | Total Return if Successful | Net Profit if Successful |
|---|---|---|
| 2× | ₹200 | ₹100 |
| 4.5× | ₹450 | ₹350 |
These calculations assume that the displayed multiplier includes the original ₹100 stake.
Under that definition, a successful 2× outcome returns ₹200 in total, consisting of the original ₹100 and ₹100 profit.
A successful 4.5× outcome returns ₹450, consisting of the original ₹100 and ₹350 profit.
However, both examples describe what happens after a successful outcome.
Neither tells us how often success occurs.
That distinction changes the entire comparison.
The Missing Factor: Probability of the Outcome
Probability measures how likely a particular event is under a defined mathematical model.
A gaming option with a larger payout may correspond to a narrower set of qualifying outcomes.
For example, imagine two fictional colour categories.
- Option A returns 2× when a qualifying outcome occurs.
- Option B returns 4.5× when a different qualifying outcome occurs.
If Option A has a 45% probability and Option B has an 18% probability, the second option offers a bigger successful return but has a lower mathematical expected return.
Those percentages are hypothetical. They have not been measured from any particular platform.
The important principle is that reward size and the probability of receiving the reward must be evaluated together.
This can be expressed through a simple formula.
Expected gross return = Probability of success × Total payout multiplier × Stake
The formula assumes a fixed return when successful and zero return otherwise.
For formats involving partial payouts, multiple settlement categories or additional charges, the calculation needs more terms.
Understanding Expected Return in Colour Trading
Expected return is a mathematical average over possible outcomes.
It does not describe the amount a player will actually receive in an individual round.
Suppose a hypothetical option offers a 2× total payout and succeeds with a probability of 45%.
Using a ₹100 stake:
Expected gross return = 0.45 × 2 × ₹100
Expected gross return = ₹90
Because the original stake was ₹100:
Expected net result = ₹90 − ₹100
Expected net result = −₹10 per ₹100 staked
The negative ₹10 is a statistical average under the assumed conditions, not a prediction that every round loses ₹10.
An actual individual outcome might return ₹200 or nothing, depending on the fictional settlement rule.
Now consider a different option.
Assume a total payout of 4.5× and a probability of 18%.
Expected gross return = 0.18 × 4.5 × ₹100
Expected gross return = ₹81
Expected net result = ₹81 − ₹100
Expected net result = −₹19 per ₹100 staked
The larger payout has a lower expected return in this example.
That is the central reason why a visually impressive multiplier can be misleading.
2× vs 4.5×: Complete Example Comparison
The table below compares hypothetical options using a ₹100 stake.
| Scenario | Payout | Assumed Success Probability | Expected Gross Return | Expected Net Result |
|---|---|---|---|---|
| A | 2× | 40% | ₹80 | −₹20 |
| B | 2× | 45% | ₹90 | −₹10 |
| C | 2× | 50% | ₹100 | ₹0 |
| D | 4.5× | 15% | ₹67.50 | −₹32.50 |
| E | 4.5× | 20% | ₹90 | −₹10 |
| F | 4.5× | 22.22% | About ₹100 | About ₹0 |
All probabilities in this table are illustrative mathematical assumptions.
Notice that Scenario B and Scenario E have different multipliers but the same expected net result.
The 2× example succeeds more frequently, while the 4.5× example provides a larger return when successful.
Despite those differences, both have an expected loss of ₹10 per ₹100 under the stated assumptions.
This illustrates why payout comparisons should never stop at the displayed multiplier.
What Is Break-Even Probability?
Break-even probability is the success probability required for the expected gross return to equal the amount staked.
For a simple binary settlement with a total-return multiplier, the formula is:
Break-even probability = 1 ÷ Payout multiplier
For 2×:
1 ÷ 2 = 0.5
The break-even probability is 50%.
For 4.5×:
1 ÷ 4.5 = 0.22222...
The break-even probability is approximately 22.22%.
This does not mean a 4.5× option actually has a 22.22% chance of succeeding.
It means the success probability would need to reach that level for the simple mathematical model to break even.
A lower actual probability produces a negative expected return.
Any applicable fees, deductions or different settlement conditions can change the result.
Why Break-Even Probability Matters
A large multiplier can create the impression of a particularly valuable reward.
Break-even probability translates that multiplier into a mathematical requirement.
Instead of asking only, "How much does it pay?", the more useful explanatory question becomes:
"What probability would be necessary to justify that total payout mathematically?"
The answer reveals information that the multiplier alone cannot provide.
It is a tool for understanding risk, not a method of forecasting winning outcomes.
Why Violet May Display a Higher Multiplier
Some colour trading formats associate Red, Green and Violet with different sets of numerical results.
For example, one commonly described 0–9 mapping assigns ordinary Red and Green associations to several digits, while Violet is associated with the special digits 0 and 5.
A category covering fewer qualifying outcomes may display a higher reward multiplier.
However, the exact relationship depends on how the platform handles its result categories.
There are several questions that a colour label alone cannot answer:
- Does the displayed multiplier include the original stake?
- Are all ten possible numbers equally likely?
- Are 0 and 5 treated as special settlement cases?
- Do Red and Green receive partial returns on certain outcomes?
- Are there deductions from the displayed amount?
Without those details, a simplified probability calculation cannot establish the expected return of the actual product.
Readers unfamiliar with the numerical classification can start with our WinGo Big Small vs Odd Even comparison.
That article explains why a number can belong to several mathematical groups without implying that every category has identical settlement conditions.
The Special Problem With Partial Payouts
A binary payout model assumes only two possibilities:
- The qualifying result occurs and the full multiplier is returned.
- The qualifying result does not occur and no return is received.
Some colour trading systems are more complicated.
A result may qualify for a reduced return rather than the ordinary full multiplier.
For example, consider a completely fictional Red selection with three possible settlement categories.
| Outcome Type | Hypothetical Probability | Total Return Multiplier |
|---|---|---|
| Ordinary qualifying result | 40% | 2× |
| Special qualifying result | 10% | 1.5× |
| Other result | 50% | 0× |
The expected multiplier becomes:
(0.40 × 2) + (0.10 × 1.5) + (0.50 × 0)
= 0.80 + 0.15
= 0.95×
For a ₹100 stake, the expected gross return is ₹95, and the expected net result is −₹5.
Compare that with ignoring the special case entirely.
If someone calculates only the ordinary 40% qualifying outcomes, the result would be 0.40 × 2 = 0.80×.
That calculation misses an additional payout category.
This fictional example demonstrates why special settlement rules cannot be ignored.
The 1.5× figure is not being presented as a verified payout for Jai Club.
Total Return vs Net Profit: A Common Multiplier Mistake
The meaning of a multiplier is especially important.
Some promotional language uses terms such as "2× returns" or "double winnings" without clearly specifying whether the original stake is included.
These two interpretations are different.
Interpretation A: 2× total return
A ₹100 stake produces a total payment of ₹200 after success.
Net profit is ₹100.
Interpretation B: 2× net profit
A ₹100 stake produces ₹200 profit plus the original ₹100, giving a total return of ₹300.
Those two settlement structures have different break-even probabilities.
For this reason, all calculations in this article explicitly treat multipliers as total returns including the original stake.
If an application defines its multiplier differently, the equations must be adjusted.
How Does House Edge Relate to the Payout?
House edge is a measure of the average portion of stakes retained by the operator under a specified mathematical model.
In a simple setting:
House edge = 1 − Expected gross return per unit staked
Suppose the expected return multiplier is 0.90×.
The calculation becomes:
1 − 0.90 = 0.10
That corresponds to a 10% theoretical house edge.
For every ₹100 staked, the mathematical expected loss would be ₹10 under the assumed probability and settlement structure.
The phrase theoretical house edge matters because an actual platform's outcome generation and settlement rules may not have been independently verified.
It is not appropriate to assign a precise house edge to an unidentified service simply because its interface shows 2× or 4.5×.
Does a Bigger Multiplier Mean Greater Risk?
A bigger multiplier often appears alongside a narrower qualifying outcome category, but it is not enough to establish the complete risk profile.
Consider two fictional options.
Option A offers frequent small returns but occasional losses.
Option B offers infrequent larger returns and more rounds without a payout.
Even if they have identical expected returns, the experience of their individual outcomes can differ substantially.
This is a distinction between expected value and variance.
Expected value describes the mathematical average.
Variance describes how widely outcomes can fluctuate around that average.
A higher-variance option may produce longer stretches without a successful outcome.
That does not make it more predictable or imply that a large reward is eventually due.
Can Previous Colour Results Change the Payout Probability?
Historical charts display completed results.
They may show streaks, repeated colours or periods with unusual-looking sequences.
However, a sequence of earlier outcomes does not independently establish the probability of the next outcome.
If the underlying results are independent, previous colours do not change the probability of the next colour.
If they are not independent, the mechanism must be independently established before any conclusion can be drawn.
A history chart alone is insufficient proof of a predictive pattern.
The same reasoning applies to unusual numerical results in lottery-style formats.
Our related article, 5D Lottery 77777 vs 12345: Which Number Is Actually Rarer?, explains why a memorable number sequence is not necessarily less likely than an ordinary-looking sequence under a uniform random model.
Both subjects illustrate the difference between how an outcome feels and how its probability is calculated.
Why a 90% Return Does Not Mean a 90% Win Rate
Another common confusion is treating return percentage as success probability.
Suppose a hypothetical colour option has an expected return of 90%.
That does not mean it wins in 90% of rounds.
A 2× option succeeding 45% of the time could produce a 90% expected gross return.
A 4.5× option succeeding 20% of the time could produce the same 90% expected gross return.
Different combinations of probabilities and payouts can lead to identical expected values.
This is why the following three concepts should be kept separate:
- Win probability: How likely a qualifying result is.
- Payout multiplier: How much is returned when a qualifying result occurs.
- Expected return: The probability-weighted average return across all possible settlement outcomes.
Confusing these values leads to incorrect conclusions about the mathematics of a game.
How to Interpret a Colour Trading Payout Table
When reading a published payout table, look beyond the largest multiplier.
First, determine whether the figure describes total return or net profit.
Next, identify the precise outcomes that qualify for each payment.
Pay attention to special numbers, partial returns and any separately defined rules.
Then distinguish published settlement terms from assumptions about the underlying probability distribution.
Finally, remember that even a correct theoretical model does not guarantee what will happen in an individual round.
A payout table can describe the financial rules of an outcome. It does not prove the game is fair, independently audited or suitable as a source of income.
Frequently Asked Questions
Is 4.5× better than 2× in colour trading?
Not necessarily. The mathematical comparison depends on the probabilities of qualifying outcomes and the actual settlement rules. A larger multiplier alone does not establish a higher expected return.
What does a 2× payout mean?
In a total-return model, a 2× payout returns twice the stake, including the original amount. Individual platforms may describe payouts differently, so their terms must be checked.
What is the break-even probability for 4.5×?
If 4.5× represents the total return and there are only win-or-lose outcomes, the break-even probability is approximately 22.22%.
Why does Violet sometimes have a higher multiplier?
Some formats associate Violet with fewer qualifying numerical results. However, actual probabilities and payouts depend on the implementation.
What is expected return?
Expected return is the probability-weighted average amount returned across possible outcomes. It is not a guaranteed payment in an individual round.
Can a 2× option still have a negative expected return?
Yes. In a simple binary total-return model, any success probability below 50% produces a negative expected return.
Do repeated Red or Green results change the next payout?
A streak alone does not change the settlement multiplier or demonstrate a change in future probability.
Does a 4.5× reward mean 4.5 times the profit?
Not necessarily. It may mean 4.5 times the total stake returned. The distinction depends on how the provider defines the multiplier.
Conclusion
The difference between 2× and 4.5× in colour trading is more complicated than the two numbers suggest.
A larger multiplier produces a larger return when the qualifying outcome occurs, but that says nothing by itself about how frequently the outcome occurs.
To understand a payout properly, readers need to distinguish the multiplier, the probability of each outcome, the treatment of special cases and the meaning of total return.
Under the simplified binary model, a 2× multiplier requires a 50% success probability to break even, while 4.5× requires approximately 22.22%.
Those are mathematical thresholds, not claims about any particular gaming platform.
For an overview of the different number, colour and lottery formats, visit the Jai Club Game guide.
A bigger displayed reward is not the same thing as a better mathematical return.