Why Is K3 Sum 10 More Common Than Sum 3? The Dice Maths Explained
Why does K3 Sum 10 have a higher theoretical probability than Sum 3? Explore three-dice combinations, all 216 possible outcomes, probability distributions and why middle totals occur more frequently.
In this article
- What Is a K3 Sum?
- Why K3 Sums Range From 3 to 18
- How Many Possible K3 Outcomes Exist?
- Why Sum 3 Is So Rare
- Why Sum 10 Has Many Combinations
- Counting All 27 Ways to Obtain Sum 10
- Calculating the Probability of K3 Sum 10
- Sum 10 vs Sum 3: Direct Comparison
- Why Middle K3 Totals Occur More Frequently
- Is Sum 11 as Common as Sum 10?
- Why Sum 3 and Sum 18 Are Equally Likely
- K3 Sum Probability vs Exact Dice Combination
- Why Sum 3 Is Also a Triple
- Does a Common Sum Offer Better Expected Returns?
- Why Result History Can Be Misleading
- Can K3 Sum Charts Predict the Next Result?
- Comparing K3 With Other Jai Club Number Games
- Frequently Asked Questions
- What is the probability of K3 Sum 10?
- What is the probability of K3 Sum 3?
- Why is Sum 10 more common than Sum 3?
- How many possible K3 outcomes exist?
- Which K3 sums are most common?
- Is Sum 18 as rare as Sum 3?
- Does a more common sum guarantee a better payout?
- Can previous K3 sums predict the next result?
- Conclusion
A K3 result shows three dice. The combined total is 10.
Another round produces a total of 3.
Both numbers belong to the possible K3 sum range, but their mathematical probabilities are very different under the standard fair-dice model.
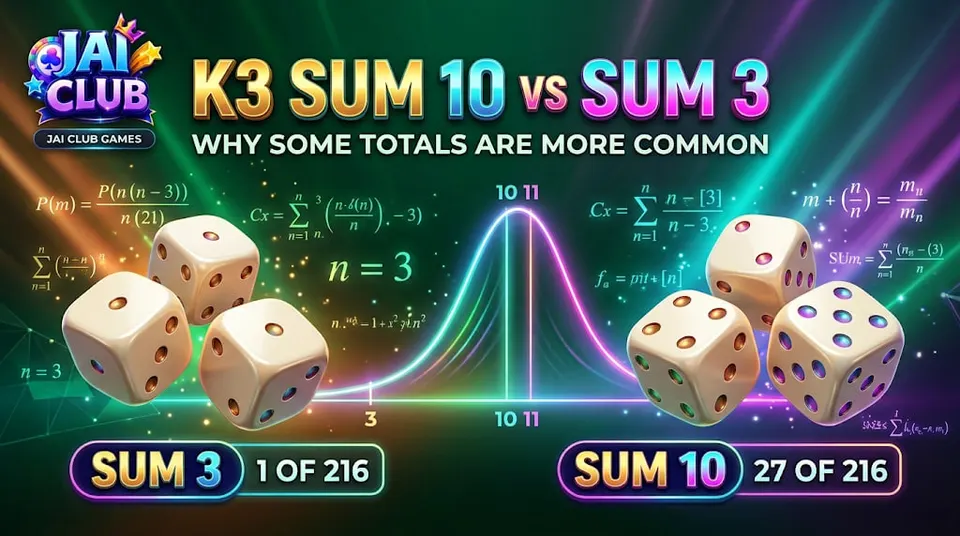
For three independent fair six-sided dice, Sum 10 has a theoretical probability of 12.5%, while Sum 3 has a probability of approximately 0.463%.
The difference exists because 10 can be produced by many different dice combinations, whereas 3 can be produced in only one way.
This is an important distinction for readers researching Jai Club K3 lottery, K3 sum probability and three-dice result frequency.
Unlike a simple model where every digit is equally likely, K3 sums do not have a uniform probability distribution.
This article explains why middle totals occur more frequently, how combinations are counted and why an outcome's mathematical probability should not be confused with the payout terms of a particular gaming platform.
All calculations use three independent fair six-sided dice. They are theoretical examples, not a verified audit of any Jai Club result-generation system.
What Is a K3 Sum?
K3 is commonly described as a three-dice lottery format.
Each die has six possible face values, from 1 through 6.
A completed result can be represented by the values appearing on the three dice.
The sum is obtained by adding those values.
For example, a result of 2, 3 and 5 produces a total of 10.
A result of 1, 1 and 1 produces a total of 3.
Both are valid mathematical outcomes.
However, a result screen may display both the individual dice values and the combined total because they provide different information.
The sum describes the overall numerical value, while the dice combination explains how that value was formed.
Why K3 Sums Range From 3 to 18
The smallest possible value on a standard six-sided die is 1.
With three dice, the smallest combined total is:
1 + 1 + 1 = 3.
The largest value on a die is 6.
Therefore, the largest combined total is:
6 + 6 + 6 = 18.
Every total between 3 and 18 can be produced through at least one valid combination.
However, the number of combinations differs between totals.
Some sums can be formed in many ways.
Others require very specific dice values.
This is the mathematical reason the probabilities are not equal.
The endpoints of the range have fewer possible combinations than many of the central totals.
How Many Possible K3 Outcomes Exist?
Each of the three dice has six possible values.
When dice are treated as distinguishable, the number of ordered outcomes is:
6 × 6 × 6 = 216.
Every ordered result contains one value for the first die, one for the second and one for the third.
Under the independent fair-dice model, all 216 ordered outcomes are equally likely.
However, this does not mean all 16 possible sums are equally likely.
Several ordered outcomes can produce the same total.
For example, 2-3-5 and 5-3-2 both produce a sum of 10.
They are different ordered outcomes but belong to the same sum category.
That distinction is essential for calculating K3 probabilities.
Why Sum 3 Is So Rare
The smallest possible K3 total is 3.
For three ordinary six-sided dice, the only way to produce that sum is:
1 + 1 + 1 = 3.
No other combination works because every die must show at least 1.
Increasing even one die above 1 would make the total greater than 3.
Therefore, the sum of 3 corresponds to exactly one ordered outcome out of 216.
Its theoretical probability is:
1 ÷ 216 = approximately 0.0046296.
Expressed as a percentage, that is approximately 0.463%.
This means Sum 3 is a comparatively rare total under the fair-dice model.
It does not mean the result is impossible or that its occurrence is evidence of an error.
Why Sum 10 Has Many Combinations
A total of 10 can be formed through several groups of dice values.
For example, 1 + 3 + 6 produces 10.
So does 1 + 4 + 5.
Another possibility is 2 + 2 + 6.
The combinations 2 + 3 + 5, 2 + 4 + 4 and 3 + 3 + 4 also produce 10.
These six groups contain all the unordered ways to obtain a total of 10 using values from 1 to 6.
However, each group may correspond to multiple ordered outcomes.
For example, the values 1, 3 and 6 can appear in six different orders.
The values 2, 2 and 6 can appear in three different orders because two dice show the same number.
This difference in arrangement counts determines the final number of possible outcomes.
Counting All 27 Ways to Obtain Sum 10
Consider the group 1, 3 and 6.
Because all three values are different, they can be arranged in six orders.
The group 1, 4 and 5 also has six orders.
The group 2, 3 and 5 contributes another six.
Now consider 2, 2 and 6.
Because two values are identical, this group produces three distinct ordered arrangements.
The same is true for 2, 4 and 4, and for 3, 3 and 4.
Each contributes three ordered outcomes.
Adding the counts gives:
6 + 6 + 6 + 3 + 3 + 3 = 27.
Therefore, there are 27 ordered outcomes that produce a total of 10.
This is substantially more than the single outcome producing Sum 3.
Calculating the Probability of K3 Sum 10
With 216 equally likely ordered outcomes and 27 producing a sum of 10, the theoretical probability is:
27 ÷ 216 = 0.125.
As a percentage:
12.5%.
That means Sum 10 occurs in approximately one out of eight rounds on average under the ideal independent fair-dice model.
However, this should not be interpreted as a guarantee that exactly one in every eight consecutive results will be 10.
Actual random sequences vary.
Several results may pass without a sum of 10 appearing.
The same total can also occur in consecutive rounds.
Probability describes the long-run distribution, not a fixed schedule of results.
Sum 10 vs Sum 3: Direct Comparison
The mathematical difference is straightforward.
Sum 3 has one ordered combination.
Sum 10 has 27 ordered combinations.
Since every ordered combination has probability 1/216 under the stated model, Sum 10 is 27 times as likely as Sum 3.
This ratio is independent of the number of rounds observed.
It follows directly from the count of possible combinations.
However, the comparison concerns mathematical outcomes.
It does not establish the relative payout multipliers offered for those sums.
A provider may apply its own settlement structure, limits and special conditions.
The difference between event probability and financial return must therefore remain clear.
Why Middle K3 Totals Occur More Frequently
Totals near the centre of the range can generally be formed through more dice combinations.
For three six-sided dice, Sum 10 and Sum 11 each have 27 ordered combinations.
They are the two most frequent totals under the standard model.
As totals move towards the extremes, fewer combinations remain possible.
For example, Sum 3 requires 1-1-1, while Sum 18 requires 6-6-6.
Both endpoints have only one ordered outcome.
This creates a symmetrical distribution.
The central totals are more common because many different combinations lead to them.
The extreme totals are less common because they require very specific arrangements.
Is Sum 11 as Common as Sum 10?
Yes, under the fair-dice model.
Both sums have 27 ordered combinations out of 216.
Therefore, each has a theoretical probability of 12.5%.
This symmetry is not a coincidence.
Every die value can be transformed by replacing it with 7 minus its original value.
For example, a die showing 1 maps to 6, while 2 maps to 5.
Under this transformation, a sum of 10 becomes a sum of 11 because the transformed total is 21 minus the original total.
The mapping pairs every outcome summing to 10 with exactly one outcome summing to 11.
Therefore, the counts must be equal.
Why Sum 3 and Sum 18 Are Equally Likely
The same symmetry explains the two extreme totals.
Sum 3 requires three ones.
Sum 18 requires three sixes.
Each is one exact ordered combination out of 216.
Therefore, both have the same theoretical probability of approximately 0.463%.
The numbers themselves are very different.
However, their positions at the opposite extremes of the possible range make their combination counts identical.
This is a useful reminder that numerical size alone does not determine probability.
A larger sum is not automatically rarer, and a smaller sum is not automatically more common.
The number of qualifying combinations is what matters.
K3 Sum Probability vs Exact Dice Combination
A sum category and an exact dice combination describe different events.
For example, Sum 10 includes the combination 1-3-6.
However, it also includes many other arrangements.
The exact ordered combination 1-3-6 has a theoretical probability of 1/216.
The broader event Sum 10 has probability 27/216.
The distinction is similar to comparing a specific K3 triple with a sum category.
Our article on K3 Triple 444 vs Sum 12 explains why an exact result and a broader numerical category can have different probabilities.
Both articles use the same 216-outcome mathematical model, but they examine different questions.
Why Sum 3 Is Also a Triple
A result of 1-1-1 is a triple because all three dice show the same value.
It is also the only combination that produces Sum 3.
This creates an important difference between the mathematical sum and the settlement rules that a particular K3 provider may apply.
Some K3 formats have special conditions for triples.
For example, a triple might receive separate treatment from an ordinary Big/Small category.
Therefore, identifying Sum 3 as mathematically belonging to a particular range does not automatically establish the corresponding financial settlement.
The actual rules need to be verified.
This is especially important when an article attempts to compare sum probabilities with advertised payout multipliers.
Does a Common Sum Offer Better Expected Returns?
Not necessarily.
A more common result may have a lower payout multiplier.
A rarer result may have a higher multiplier.
To evaluate expected return, the event probability must be considered together with the amount paid when the event qualifies.
For example, a 12.5% probability does not automatically mean a particular selection is financially favourable.
The offered multiplier could be below the mathematical break-even level.
Likewise, a rare result is not automatically advantageous because the payout looks large.
The provider's complete payout rules are needed to assess that relationship.
This guide does not assign unverified Jai Club payout figures to Sum 10 or Sum 3.
Why Result History Can Be Misleading
A result history may show several consecutive sums.
Someone might notice that Sum 10 appears frequently while Sum 3 has not appeared for a long time.
This is consistent with their different theoretical probabilities, but a short history cannot establish the exact underlying distribution.
It also does not mean Sum 3 is guaranteed to appear soon.
Under independent fair dice, each new round has the same theoretical probability of Sum 3 regardless of how many earlier rounds did not produce it.
Similarly, a recent Sum 10 does not prevent another Sum 10 from appearing immediately afterwards.
The probability distribution and the observed sequence are different concepts.
Can K3 Sum Charts Predict the Next Result?
A chart can help describe completed results and show how frequently different sums have appeared within a sample.
However, that is not equivalent to predicting an unknown future outcome.
For example, the theoretical probability of Sum 10 is 12.5%.
A chart containing only a small number of rounds may show a different observed percentage.
That variation does not automatically indicate a new pattern.
A reliable assessment of a real game would require sufficient data and information about the actual result-generation mechanism.
Even then, describing historical frequencies is different from guaranteeing the next result.
No previous sequence mathematically requires a particular sum to appear next.
Comparing K3 With Other Jai Club Number Games
K3 is different from WinGo because it involves the sum of three numerical values.
Under an ideal uniform WinGo digit model, each number from 0 through 9 has the same theoretical probability.
K3 sums, by contrast, have different probabilities because several dice combinations can produce the same total.
A result of 5 in a one-digit game therefore does not have the same theoretical probability as a K3 sum of 5.
The number alone is insufficient to describe the event.
For broader information about how result formats differ, visit the Jai Club Game information hub.
The correct mathematical model depends on the game being examined.
Frequently Asked Questions
What is the probability of K3 Sum 10?
Under three independent fair six-sided dice, the probability is 27/216, or 12.5%.
What is the probability of K3 Sum 3?
There is one qualifying combination, giving a probability of 1/216, approximately 0.463%.
Why is Sum 10 more common than Sum 3?
Sum 10 can occur through 27 ordered combinations, while Sum 3 can occur only through 1-1-1.
How many possible K3 outcomes exist?
Three distinguishable six-sided dice produce 216 ordered outcomes.
Which K3 sums are most common?
Sum 10 and Sum 11 are the most common under the fair-dice model, each with 27 combinations.
Is Sum 18 as rare as Sum 3?
Yes. Each extreme total has exactly one ordered combination.
Does a more common sum guarantee a better payout?
No. The actual expected return depends on probability and the provider's payout terms.
Can previous K3 sums predict the next result?
A history of independent outcomes does not provide a guaranteed prediction for the next round.
Conclusion
K3 Sum 10 is mathematically more common than Sum 3 because many different dice combinations can produce the middle total.
Sum 10 has 27 ordered combinations out of 216, giving a theoretical probability of 12.5%.
Sum 3 requires the exact result 1-1-1, giving a probability of approximately 0.463%.
This difference explains why the K3 sum distribution is concentrated around the middle rather than being uniform across all totals.
For more explanations of three-dice combinations, read K3 Triple 444 vs Sum 12.
The mathematics helps explain why some sums are more common. It does not guarantee when a particular result will appear or whether a selection will be profitable.